2 min read
-
Investors often wonder if there is an optimal hedge ratio that can be established once and for all and left unchanged.
-
It is well understood that currencies have mean-reverting tendencies, but that the swings in exchange rates can have an unacceptable impact on performance in the shorter term.
-
As a result, any degree of hedging is beneficial as opposed to not hedging at all (see The Danger of Doing Nothing).
-
However, currencies experience dramatic regime changes over time, which means that a fixed hedge ratio can be sub-optimal for long periods.
CASE STUDY: THE IMPACT OF CURRENCY EXPOSURE ON INTERNATIONAL EQUITY RETURNS (1990-2019) FOR US INVESTORS
The following analysis is for US dollar based portfolios, but the same observations can be made for any major base currency.
There have been huge differences in returns for hedged versus unhedged international equities over the past 30 years.
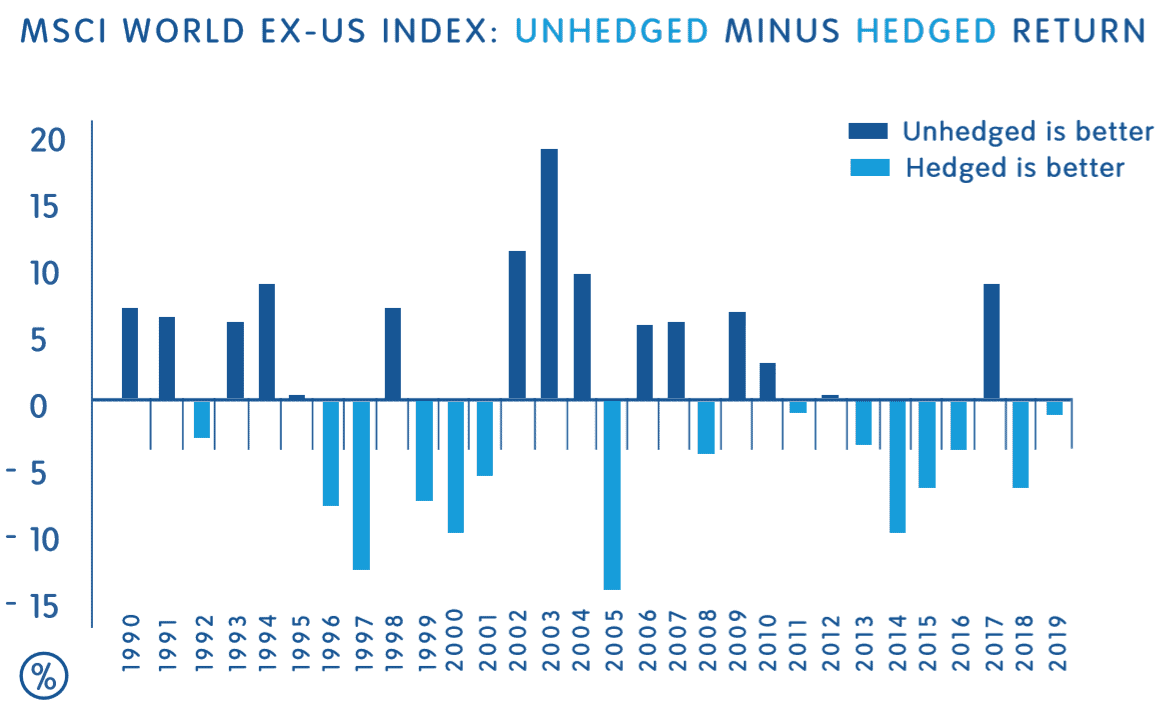
Source: Millennium Global and Bloomberg, 1990 to 2019. Analysis is based on the MSCI World ex-US Index. Sourced on 31 March 2020.
In spite of the swings from year to year, if we look at the entire period we can see a fairly linear trade-off between risk and return as currency hedging is increased.
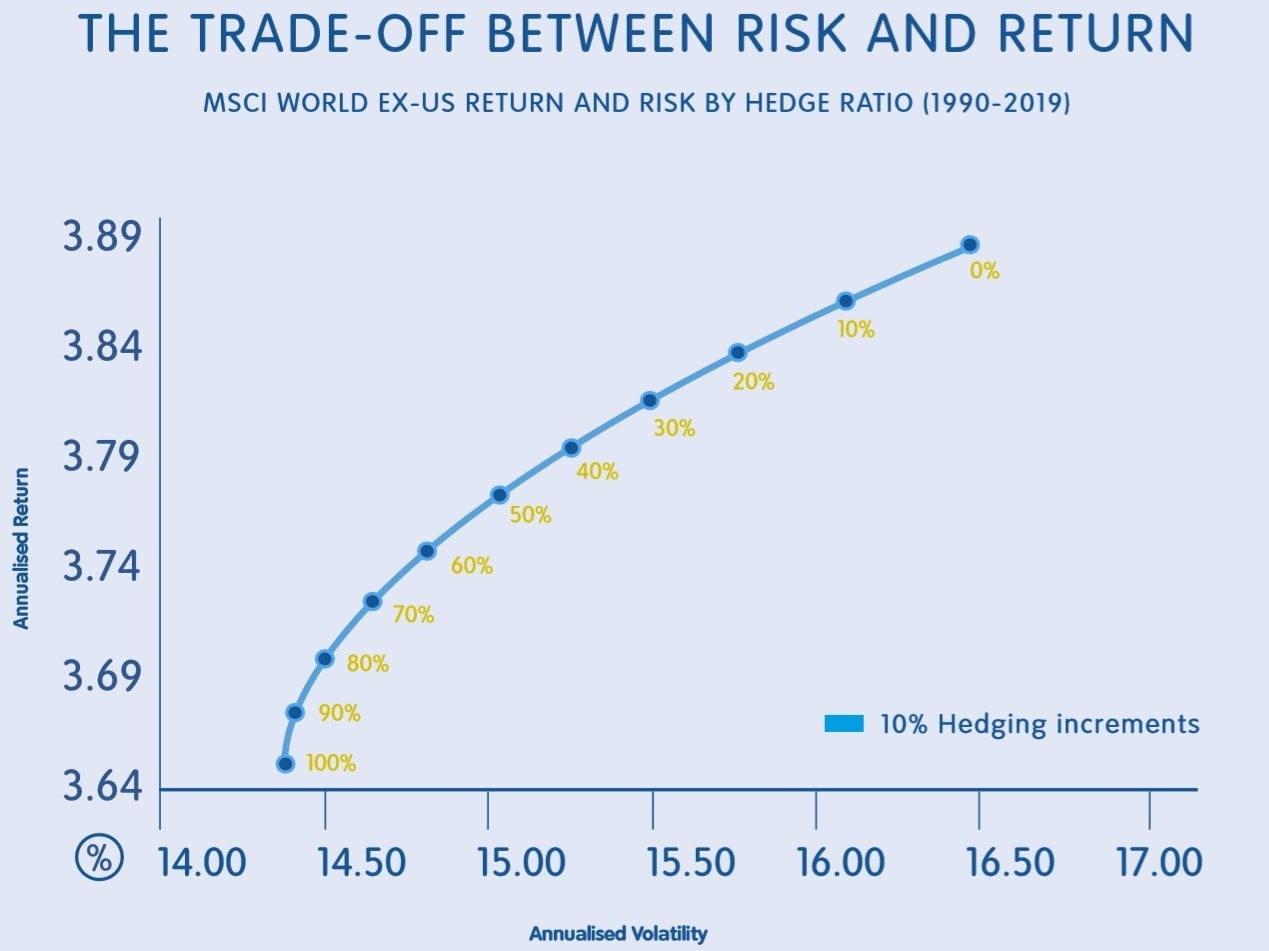
Source: Millennium Global and Bloomberg, 1990 to 2019. Analysis is based on the MSCI World ex-US Index. Sourced on 31 March 2020.
However, if the timeline is split into shorter periods, a very different story emerges.
The following four charts divide the same time frame into periods of US dollar trends and the outcomes are very different.
PERIOD 1
During this period a 100% hedge ratio would have reduced risk by over 2% per annum but at a cost of reducing the return by almost 7% per annum. Arguably, a zero-hedge policy would have been preferable given the significant increase in return for a relatively modest increase in risk.
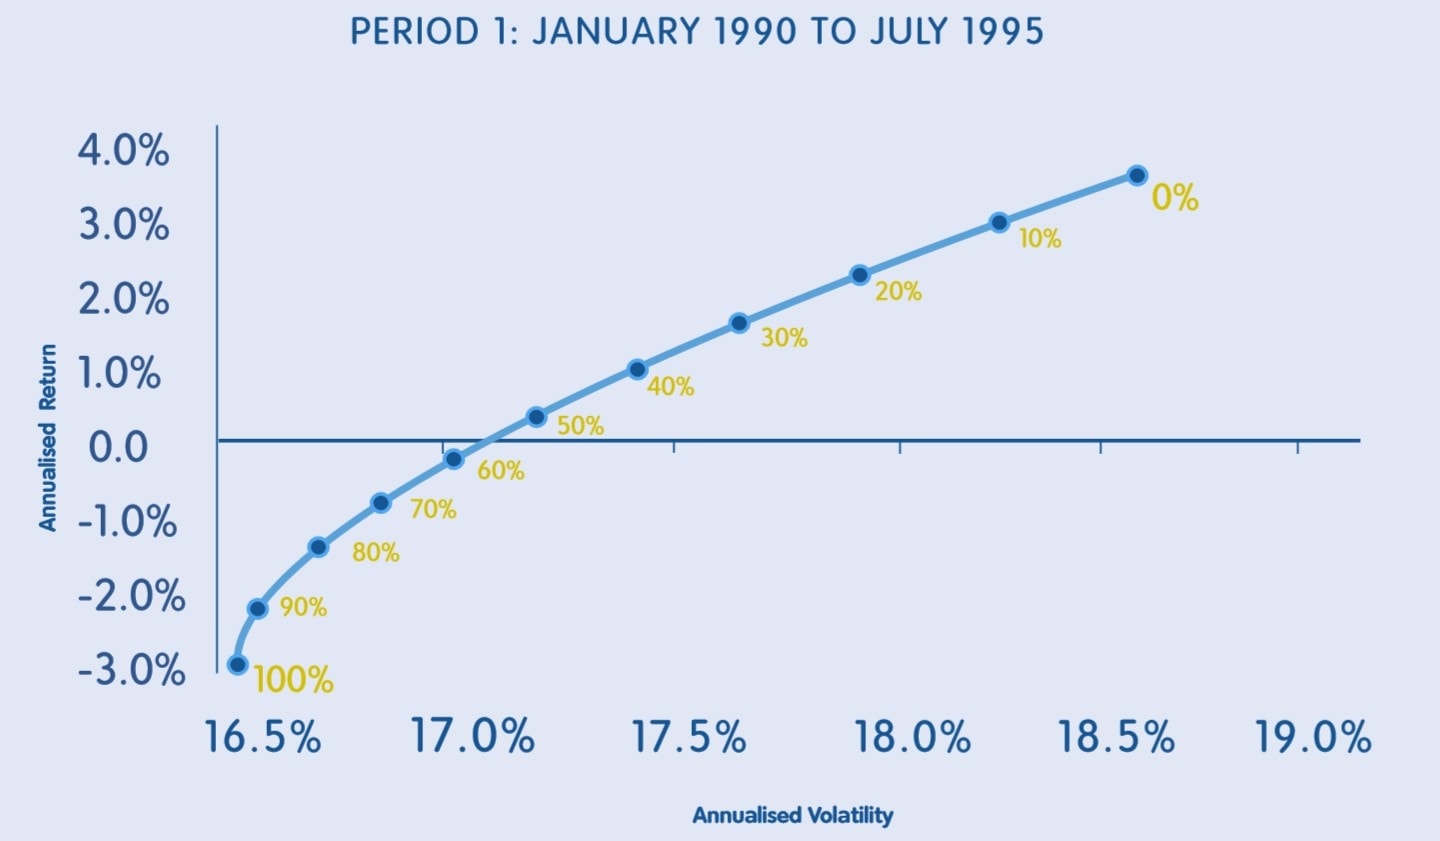
Source: Millennium Global and Bloomberg, 1990 to 1995. Analysis is based on the MSCI World ex-US Index. Sourced on 31 March 2020.
PERIOD 2
In Period 2, a zero-hedge policy would have been the worst outcome in return terms – almost 8% per annum worse off than a 100% hedge. It also had a slightly higher level of risk and so was the worst of all worlds. The 100% hedged solution would have been preferable given the significant return enhancement.
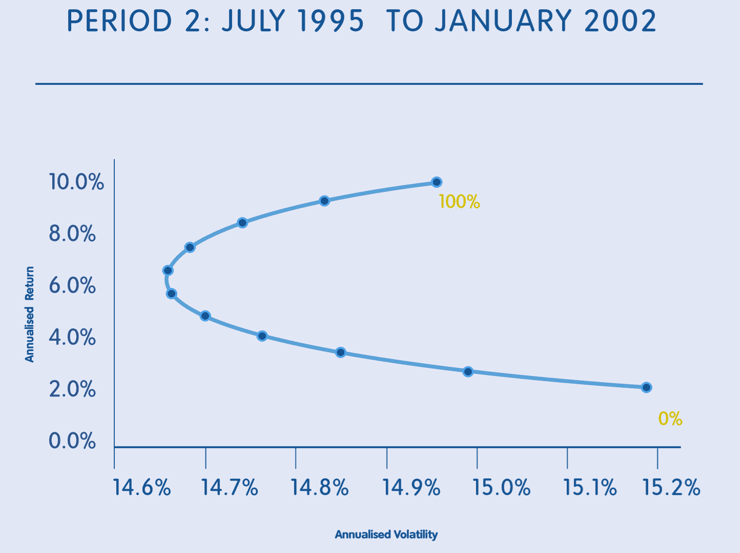
Source: Millennium Global and Bloomberg, 1995 to 2002. Analysis is based on the MSCI World ex-US Index. Sourced on 31 March 2020.
PERIOD 3
In Period 3, the 100% hedge strategy preferable in the previous period would have led to a 7% per annum worse return versus an unhedged strategy for a marginally lower level of risk. Once again, the return consequences and the associated cost of making the wrong decision are very high.
Any hedge above 50% would have provided a lower return and higher risk and so would have been increasingly worse off in both dimensions.
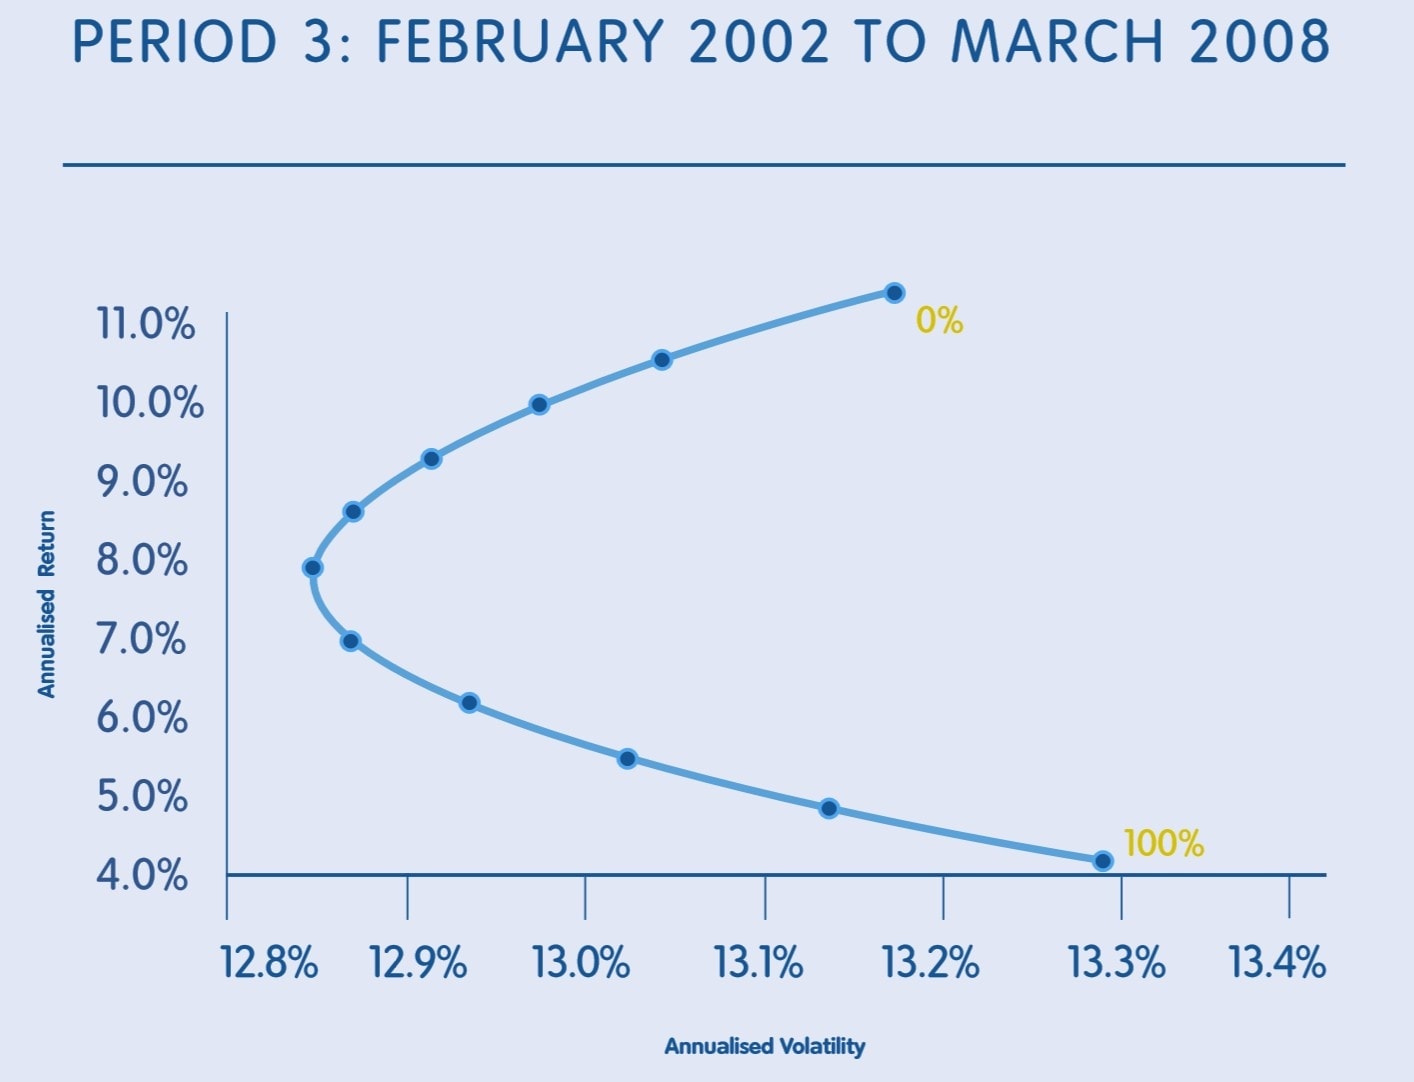
Source: Millennium Global and Bloomberg, 2002 to 2008. Analysis is based on the MSCI World ex-US Index. Sourced on 31 March 2020.
PERIOD 4
In Period 4, the best policy would have been a 100% hedge, which would have produced an unequivocally better outcome than an unhedged or partially hedged strategy.
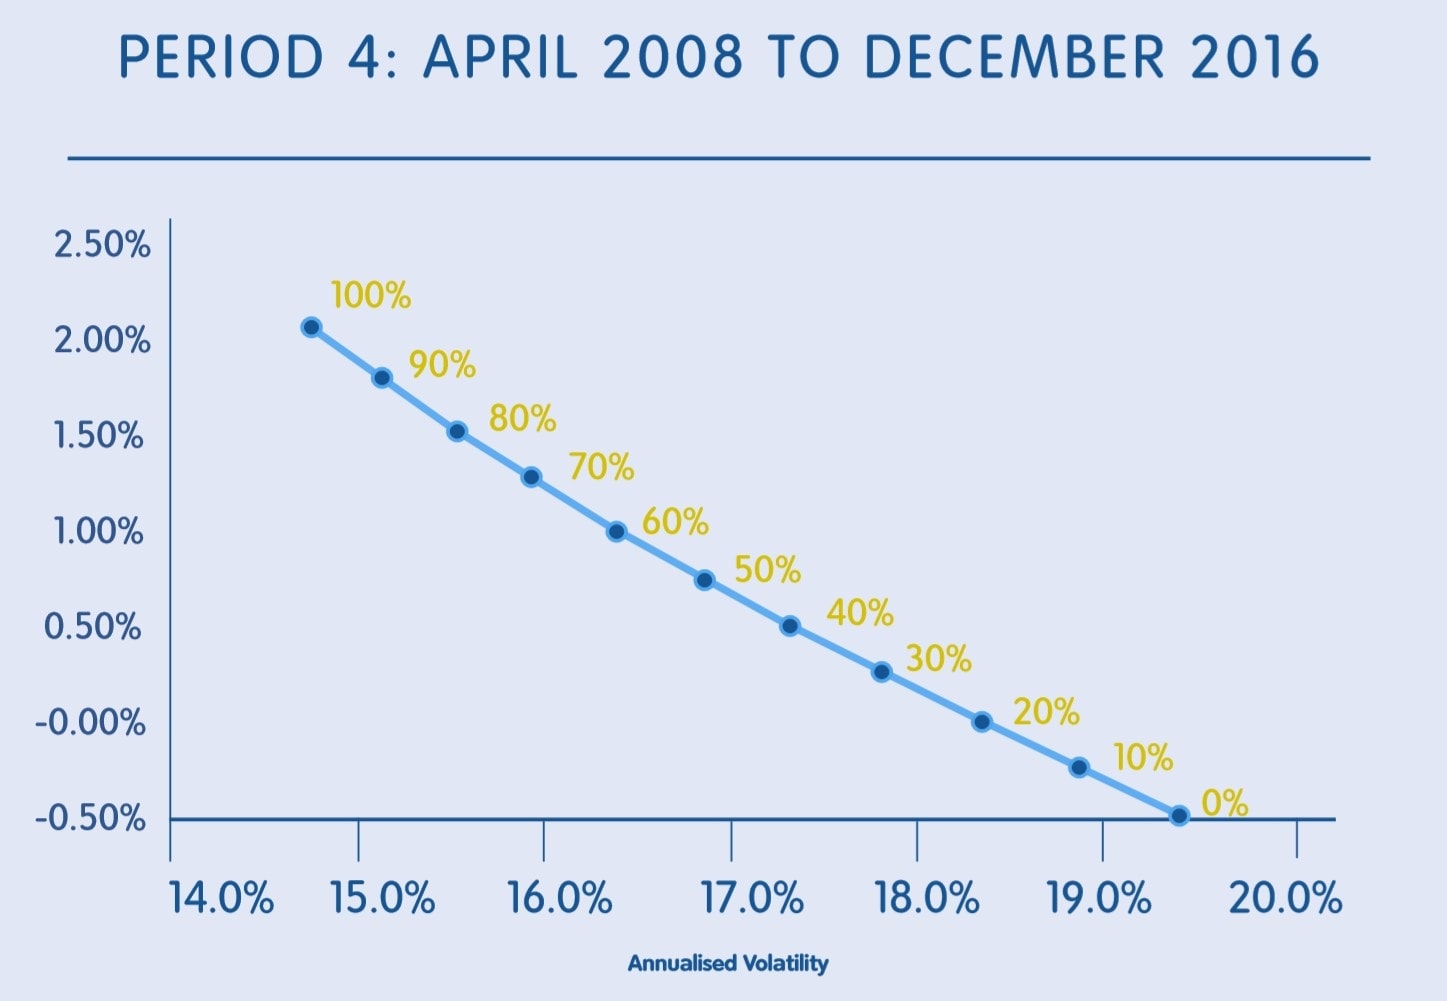
Source: Millennium Global and Bloomberg, 2008 to 2016. Analysis is based on the MSCI World ex-US Index. Sourced on 31 March 2020.
Consequences can be equally dramatic over shorter time frames. In volatile market environments, the results during a multi-year period can be diametrically opposite to those achieved from a shorter window within that same period.
For example, the 4 year period encompassing the whole Global Financial Crisis around 2008 shows completely different results from the 1 year period at the epicentre of the crisis between March 2008 and March 2009 (see below).
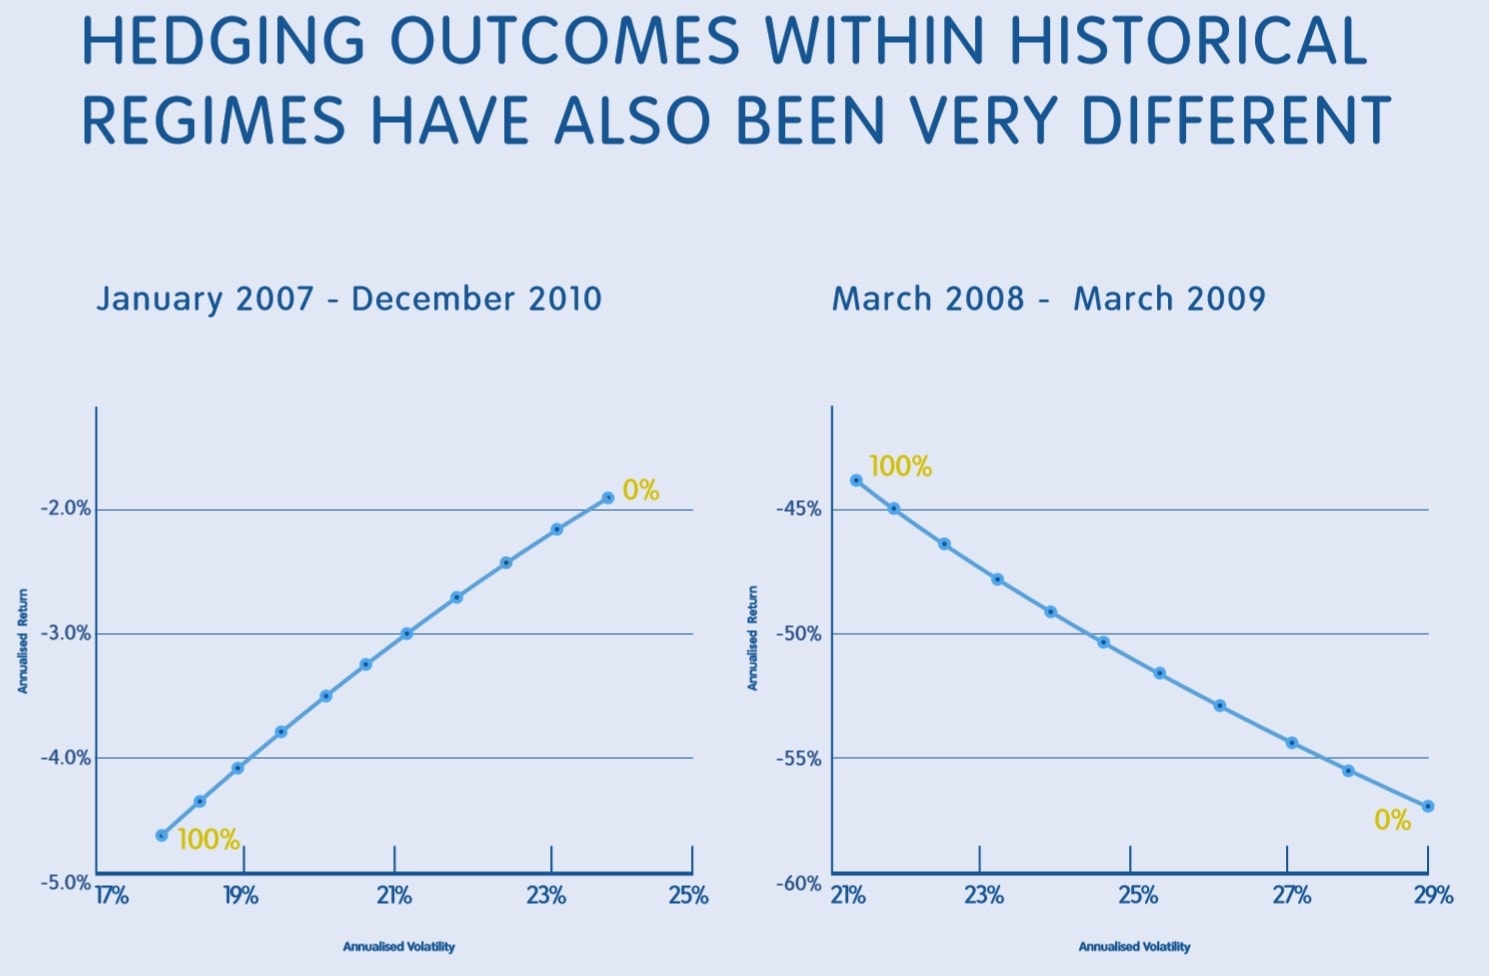
Source: Millennium Global and Bloomberg, 2007 to 2010. Analysis is based on the MSCI World ex-US Index. Sourced on 31 March 2020.
Key Takeaways
- There is no universal answer to the question “what is the optimal hedge ratio?” It varies greatly with the time period.
- The recent past is not a good guide to the immediate future.
- A flexible approach to the level of the hedge ratio may provide a better outcome.
If you have any questions, please contact us.


Taking on the future: Machine Learning in FX Risk Management
By Justin Gang Xu, Head of Risk The global foreign exchange markets are primarily influenced by a combination of fundamental and market dynamic...